
5 Essential GA4 Metrics for Tracking Page Performance

Plus, how to Use Them to Drive Engagement & Sales.
If you're using Google Analytics 4 (GA4) but aren’t sure which metrics actually matter, you're not alone. GA4 introduces a more event-driven approach to tracking, which means businesses need to rethink how they measure success. To get the most out of your web analytics, you need to focus on the right data… the metrics that directly impact engagement, conversions, and revenue.
Here are the five essential GA4 metrics every business should track to measure page performance and actionable ways to use them to improve your website’s effectiveness.
1. Engagement Rate
Why It Matters: Engagement rate measures the percentage of sessions that result in meaningful interactions. Google has defined this as any session that meets any of the following criteria (source: Google):
- Lasts longer than 10 seconds
- Has a key event, such as a conversion
- Has 2 or more screen or page views
How to Use It:
- Identify pages with low engagement rates and optimize them with better UX, clearer CTAs, and more compelling content.
- A/B test different layouts, headlines, or CTAs to see what keeps users engaged.
- Use heatmaps (via tools like Hotjar or Microsoft Clarity) to analyze user behavior and optimize for better engagement.
Where to find it:
- Under the reports section in your GA4 property, navigate to the reporting view where you’d like to see this metric. I find this metric especially useful in these 2 reports:
- “Session Acquisition” reports to monitor the quality of your traffic mix (i.e. which channel / campaign is driving the most valuable customers).
- “Pages and screens” report will help you monitor the engagement level of pages throughout your site
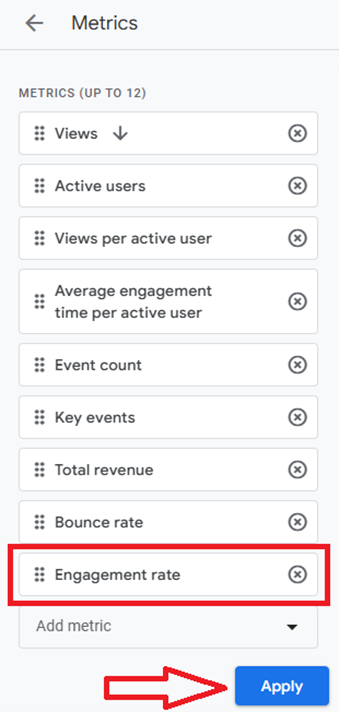
- Note, the metric won’t be available in the “Pages and screens” report out of the box, but no worries! We can add it by clicking the pencil icon to “customize report” in the upper-right corner (source: Google).
- Click “Add metric” (near the bottom of the right menu).
- Type "Engagement rate" (if the metric doesn't appear, it's already included in the report).
- Click “Apply”:
2. Average Engagement Time per Session
Why It Matters: This metric tells you how long users are actively engaging with your site content, as opposed to just loading a page and leaving.
How to Use It:
- Pinpoint which pages keep users hooked and analyze what makes them engaging.
- If time-on-page is low, consider adding interactive elements, more engaging copy, or video content to keep users on the page longer.
- An insight that I rarely hear discussed in eCommerce – if the engagement time on a specific page is significantly higher than average, that could mean that your customers are having a hard time finding what they’re looking for on that page.
- Check if mobile users have significantly lower engagement times, which could indicate a mobile UX issue that needs fixing.
Where to find it:
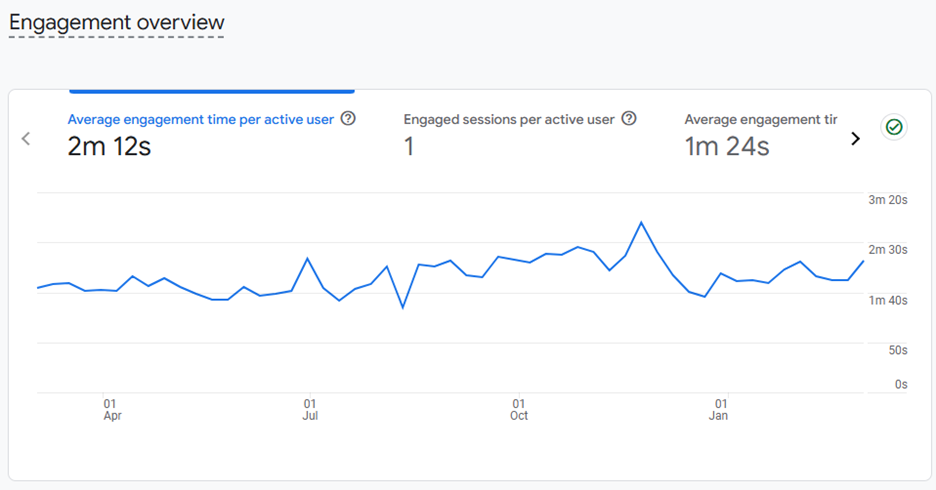
- Under the reports section in your GA4 property, navigate to “Engagement”
- Click “Average engagement time” (which you can see tracked by user or session, difference is explained here):
3. Event Count (and Top Events Tracked)
Why It Matters: GA4 tracks user interactions as events, so monitoring your top events helps you understand what actions users take on your site.
How to Use It:
- Set up key event tracking (like button clicks, video views, form submissions) and monitor how often they occur.
- Identify pages where important events (like “add to cart” or “sign-up” clicks) are low. These pages may need stronger calls to action or better design.
- Compare event data before and after UX or content changes to see what works best.
Where to find it:
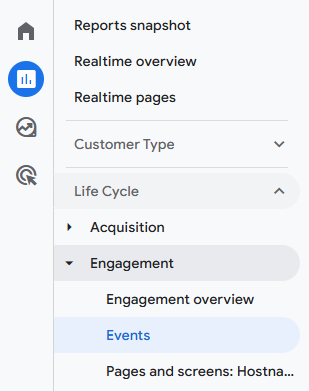
- Under the reports section in your GA4 property, navigate to “Engagement” > “Events”:
4. Scroll Depth Tracking
Why It Matters: This measures how far down the page users scroll before leaving. If users aren’t reaching key content sections, they’re missing out on important messaging or CTAs. Note, scroll depth is calculated as a percentage where 100% means the user has scrolled all the way down to the bottom of the page (so of course, the higher the better in most cases).
How to Use It:
- Identify where users drop off on important pages and move key CTAs higher up the page.
- Use sticky elements (like floating CTAs) to keep conversion buttons in view.
- Add engaging elements (like images, infographics, or pull quotes) at drop-off points to encourage users to keep scrolling.
- Learn from your top pages by replicating the structure on less successful pages.
Where to find it:
- Under the reports section in your GA4 property, navigate to “Engagement” > “Events” (see screenshot below).
- By default, the event will be counted every time a user scrolls down 90% of the page.
- If the event isn’t available, you’ll need to connect with your GA4 admin to have the event setup. Semrush wrote this great article that goes into detail on how to configure.
Pro tip:
- This metric becomes really useful when using a custom “Explore” report view so that you can analyze scroll depth at the page level. Do that by:
- navigating to “Explore”
- select a blank report
- select “Page path and screen class” and “Event name” as a dimension
- select “Event count” as a metric
- add a filter on the “Event Name” metric so that it only counts the “scroll” event
5. Conversion Rate (now called "Key Event Rate")
Why It Matters: Ultimately, the goal of most pages is to drive a conversion. Whether that’s making a purchase, signing up for a newsletter, or booking a demo. This metric shows which pages actually lead to conversions.
How to Use It:
- Compare high- vs. low-converting pages and look for patterns in content, design, or CTAs that work.
- If a page has high traffic but low conversions, consider adjusting messaging, CTA placement, or page load speed.
- Use multi-step conversion funnels in GA4 to identify at which stage users drop off, so you can fine-tune the conversion process.
Where to find it:
- Add the metric to a standard GA4 report by clicking customize in the top right of the report (like for engagement rate discussed above). Or build an exploration report with conversion rate and any other dimension you’d like to include. Analytics mania has a really great run down on how to configure this here.
Final Thoughts
GA4 provides powerful, event-based insights that allow businesses to track user behavior more effectively than ever. But the key to success isn’t just collecting data... it’s knowing how to act on it. By focusing on these five essential metrics, you can optimize page performance, increase engagement, and ultimately boost sales.
What GA4 metrics have you found most useful? Share your insights in the comments!